Search This Blog

Notification on Cacti


Cacti provides compatibility to send notification when any events occurred. Notification is every important option for every monitoring system because we cannot look at the computer screen all the times. Notification on Cacti is the way that, Cacti will send message to notify the administrator when any devices down or any abnormal events. So, let’s start how to configure it. First of all, we need to install mail service mostly postfix, and mailx which is the command line utility that allow us to send mail from command line. Cacti can send notification to local mail and external mail like Gmail. 
Install Postfix
Postfix is the mail service on Linux.

yum install postfix -y

Restart postfix service

system restart postfix
systemctl enable postifx

In order to send email from command line on Linux, we need to install mail command utility.

yum install mailx -y

Cacti send notification to local mail

Cacti can send email notification within three of mail services PHP Mail() Function, Sendmail, SMTP. Go to the web interface of Cacti -> Configuration -> Settings -> Mail/Reporting/DNS.


Fill in the following field.
Test Email: the destination email that we want to Cacti to notify for any events.
Mail Services: chose the sending method to send notification
Ping Mail Server: this option is to ping before send
From Email Address:  the source email address of the notification
From Name: it is an alias name.
Next, click on Save and Send a Test Email. We will see the pop-up screen indicate that Test Email Results is Success.


To verify that user jipo surely get the notification message. Go to command line cat /var/mail/jipo. We will see the message in jipo’s mail box.


The other method for sending notification is that using Sendmail option. This option is not much different from PHP Mailer. Go to the web interface of Cacti -> Configuration -> Settings -> Mail/Reporting/DNS. And select Mail services as Sendmail and fill the Sendmail path as /usr/bin/mailx. When we complete the required file Save, and Send a Test Email.


The message indicates the sending status pop-up here.


To verify that user jipo surely get the notification message. Go to command line cat /var/mail/jipo. We will see the message in jipo’s mail box. So, the result is the same right.


Cacti send notification to Gmail

Cacti can be configured to send notification to Gmail. That’s Awesome!!
First, we need to allow Less secure app access on Gmail by follow the link below and then turn it ON. https://myaccount.google.com/lesssecureapps?pli=1


Go to the web interface of Cacti -> Configuration -> Settings -> Mail/Reporting/DNS.
For example I want to send notification from Cacti by using email source@gmail.com and destination email as dest@gmail.com .
Test Email: the destination email that will get the notification for any events notified by Cacti (dest@gmail.com )
Mail Services: chose SMTP because we need to authenticate by SMTP. The idea about SMTP is that we need to login into Gmail before we can send email.
From Email Address: the email address that use to send notification (source@gmail.com )
SMTP Hostname: smtp.gmail.com
SMTP Port: 587
SMTP Username: source@gmail.com
SMTP Password: xxxxx
SMTP Security: TLS
Then click on Save, then Send a Testing Email.


The pop-up message will appear. This message will show whether Test Send is success or failed.


Here below is the message that we send test from Cacti notification.


Conclusion
I hope you all be able to understand this post well. If you don't understand any point or  have any problem, recommendation, suggestion don't hesitate to tell us, we will try our best to help.


How to Install Plugin on Cacti

Cacti Plugins

Not only providing more and more powerful features, Cacti also compatible with many useful plugins to make its productivity more flexible. Cacti support many plugins like Monitor plugin, Thold plugin, Weathermap plugin and many more. In this post we will show how to install plugins on Cacti and we will install Monitor, Thold, and Weathermap.

Monitor Plugins

Monitor plugin enables Cacti to display all hosts status UP or Down on a single page. For the latest Cacti version support some plugins and some not yet, if we use Cacti old version under 0.xx version there are many plugin that it support. For the latest version Monitor plugin is available in Github.com. There are two common ways to install plugin on cacti:

Method #1

Go to https://github.com/Cacti/plugin_monitor and Donwload ZIP then copy by ssh or WinScp or other method to the server.


Method #2

yum install git -y

Copy the URL of that project and clone it with git command.


Clone project with git command.

git clone https://github.com/Cacti/plugin_monitor.git

If we installed cacti with specific version by manually the plugin path is /var/www/html/cacti/plugins/. If we installed Cacti with yum install cacti -y command the plugin path is /usr/share/cacti/plugins. Copy it to the right location and name as monitor.

cp -R plugin_monitor /var/www/html/cacti/plugins/monitor

change ownership to apache user.

chown apache.apache -R /var/www/html/cacti/plugins/monitor/

After we download or clone with git command, copy and name monitor to the correct location, now it is time to install it.

Install Monitor Plugin

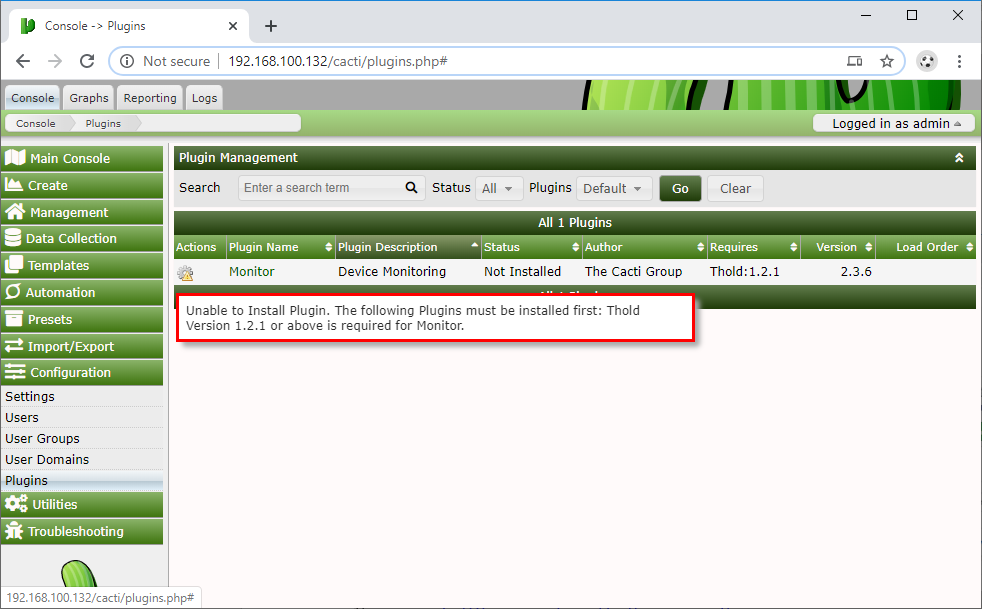
Go to Configuration -> Plugins, we see that our plugin is here move the mouse hover the Setting sign under Actions. There is a warning message.


We notice that, Monitor Plugin requires Thold plugins to make it works.


Go to https://github.com/Cacti/plugin_thold/releases right click on Source code (zip) and Copy Link address.


Download thold plugin with wget command.

wget https://github.com/Cacti/plugin_thold/archive/v1.3.3.zip

Unzip the file with unzip command.

unzip v1.3.2.zip

Move to the right path and name it as thold.

mv plugin_thold-1.3.2 /var/www/html/cacti/plugins/thold

Chang ownership of that directory to apache user.

chown apache.apache -R /var/www/html/cacti/plugins/thold

Install thold plugin
Go to Configuration ->  Plugins click on setting sign.


Now, the thold plugin is installed, click on tick sign to enable it.


Now, we can install the Monitor plugin after the thold plugin is installed. Follow the same step of thold plugin.


Click on the tick sign to enable it.


Check Result

We see that Monitor Plugin tab is shown, and we see that below monitor icons about all devices  and devices are up.


Weathermap Plugin

Weathermap plugin allow us to draw network diagram with the graph view of each link. To install weathermap plugin follow the step below.

git clone https://github.com/thurban/plugin_weathermap.git

Copy to the right directory in Cacti location.

mv plugin_weathermap/ /var/www/html/cacti/plugins/weathermap

Change ownership to apache user.

chown apache.apache -R /var/www/html/cacti/plugins/weathermap

To install Weathermap plugin, we follow the same way as thold and monitor plugin.
Go to Configuration -> Plugins -> 


Click on tick sign to enable it.


Check the Results

We can see that new Weathermap plugin is shown on top of the page.


Conclusion

I hope you all be able to understand this post well. If you have any problem, recommend, suggestion don't hesitate to tell me for the future development.
You may also like:

READ: How to install Cacti on Centos 7 
READ: How to install Cacti specific version on Centos 7 
READ: How to add Windows and Linux host to Cacti
READ: How to create Graph Tree on Cacti

How to create Graph Tree on Cacti

Cacti not only provides the powerful features like monitor network traffic, CPU, resources utilization, and Cacti also offer Graph Tree feature that allow us to categorize the tree view of the graph based on device role, device type, device location and so on. In this post, we will show about how to create graph tree on it.

Graph Tree 

Cacti comes with the default graph trees, for the real work we need to customize the default based on our requirements.


I have added five devices their names based on the some provinces in Cambodia. We will create new graph tree according to these names.


Create Graph Tree

To create graph tree, go to Management -> Trees -> plus sign + on the top right side.


 Give the friendly name of new graph tree Provinces and choose the Sorting Type. Sorting Type is how the graph tree organized and click on Create.


 Now, we see all the available sites, available Devices, available graphs which we can drag and drop. Click on Edit button to edit this tree.


To make it easy to understand let drag and drop SIEM-REAP device to the graph tree. To publish the new graph tree change Publish option to active, Save and Finish Editing Tree.


Check Result

Go to Graphs tab, we see the new graph tree Provinces is published  and device SIEM-REAP is under it.


Graph Tree Branch

We are done for creating new graph tree. For best practice in the real work, we should categorize our graph tree based on the device roles, device type, location and so on. We will create graph tree branches according to the province names. Go to Management -> Tree and click on Province because we will add new branch on this graph tree.


 Click on Edit Tree button.


Click on Add Root Branch and put the name for the new branch SR, drag and drop device SIEM-REAP under it. Save -> Finish Editing Tree. For the other provinces we can do the same step.
   

Check Result

Go to Graphs tab again we now see the branches of Provinces graph tree are shown here.


Conclusion

I hope you all be able to understand this post well. If you don't understand any point or  have any problem, recommendation, suggestion don't hesitate to tell us, we will try our best to help. You may also like Related Posted:

Monitor Linux and Windows

Cacti can monitor most of the network device that support SNMP. In this guide, show how to monitor Linux and Windows host on Cacti. In this scenarios we use Centos 7 and Windows 7 to monitor on Cacti.

Monitor Cent OS 7

To be able to monitor Cent OS 7 on Cacti, we need to install SNMP service.

Update our system to get the latest update.

yum update –y

Install Net-SNMP

yum -y install net-snmp net-snmp-utils

Restart service and enable to auto start when server start up.

systemctl restart snmpd
systemctl enable snmpd
Configure SNMP

Make change on snmp default configuration.

vi /etc/snmp/snmpd.conf

# line 41: comment out

#com2sec notConfigUser default public

# line 74,75: uncomment and change
# change "mynetwork" to your own network
# change comunity name to anyone except public, private (for security reason)

com2sec local localhost start-do-its
com2sec mynetwork 192.168.100.0/24 start-do-its

# line 78,79: uncomment and change

group MyRWGroup v2c local
group MyROGroup v2c mynetwork

# line 85: uncomment

view all included .1 80

# line 93,94: uncomment and change

access MyROGroup "" v2c noauth exact all none none
access MyRWGroup "" v2c noauth exact all all all

# line 323: uncomment
disk / 10000

Allow Firewalld

firewall-cmd --zone=public --add-service snmp --permanent
firewall-cmd --reload

Add Cent OS 7 to Cacti

Go to Cacti web interface under Main Console -> Create -> New Device.

Please fill in the follow field. If we don't understand what to fill in each field, we can hover mouse on the question mark ?. 
Description: give the description for this device.
Hostname: the ip address or device name but make sure our DNS is resolve properly.
Device Template: choose the right device template Net-SNMP Device for Linux host.
SNMP Version: choose the correct version based on snmp version that we install on Linux host.
SNMP Community String: specify the snmp community that match with string we configure on device to monitor.
Downed Device Detection: choose SNMP uptime. 
Then click on Create.


Create Graph

After we clicked on Create, we can see the information about this device at the top SNMP Information. To create graph, go to Create Graphs for this Device on the right side to create graph for this device.


Select device in Device that we want to create graph for it, and select the Graph Type for which type of graph we are going to create for this device. In this scenario we selected the graph type SNMP – Get Mounted Partitions, it will show all the mounted partitions on this device and check the box at the right side for which partition we want to graph and click on Create.


If we want to create graph for the Interface Traffic, we can choose the graph type SNMP - Interface Statistics and select which interface that we want to graph, choose In/Out Bits click on Create.


If we want to see all the available graphs for this device, we can choose Graph Type All then scroll down all the available graphs will be there.


Check Result

After we created all the graph for this device, we need to wait for 5 minutes, to see the result go to Management tab => Graphs and select device that want to see its all graph.  Ex: we click on Traffic – 192.168.100.130(ens33) we will see the network traffic of this interface on that device.


After we created all the graph for this device, we need to wait for 5 minutes, to see the result go to Management tab => Graphs and select device that want to see its all graph.  Ex: we click on Traffic we will see the network traffic of this interface on that device.


Ex: The graph of Physical Memory on this device.


Monitor Windows 7

Enable SNMP on Windows host


To add windows, host to the Cacti, first we need to install SNMP service on the managed device. In this post we install snmp service on Windows 7. To do that, go to Control Panel => Programs and Features => Turn Windows feature on or off and tick the box Simple Network Management Protocol (SNMP) and WMI SNMP Provider then restart.


After the computer is started, go to service by hold the Windows Key + R and type services.msc an then right click on SNMP Service => Properties.


Go to Agent tab and tick all the check box below and fill the information in Contact and Location. And click on Apply.


After that, go to the Security tab and add the SNMP community string, check the Accept the SNMP packet from any host. Click on OK.


Add Windows host to Cacti

We can follow the previous step to add new device or we can do the other method by going to Management => Devices =>plus sign (+).


It is not different from the previous step but just this time we choose the Device Template Windows Device.


Create Graph

Go to Create graph for this Device to make graph for this device.


We do almost the same in this example we want to graph only the Interface of this device. Choose the device name in Device => Graph Type => Interface => In/Out Bits => Create.


Check Result

Wait for 5 minutes, and do the same step as previous to see the graph


Here is the network traffic on the network card of windows 7.


Conclusion
I hope you all be able to understand this post well. If you don't understand any point or  have any problem, recommendation, suggestion don't hesitate to tell us, we will try our best to help. You may also like Related Posted:

READ: How to install Cacti specific version on Centos 7
READHow to install Cacti on Centos 7

How to monitor Cisco Switch , Router, Linux and Windows on Zabbix

1. Install Zabbix Agent on Rocky Linux 9 Install zabbix repository. rpm -Uvh https://repo.zabbix.com/zabbix/7.0/rocky/9/x86_64/zabb...